Carol Ann Robertson
A 4th grade teacher at Betty Plasencia Elementary in 2009
These graphs show a teacher's "value-added" rating based on his or her students' progress on the California Standards Tests in math and English. The Times’ analysis used all valid student scores available for this teacher from the 2002-03 through 2008-09 academic years. The value-added scores reflect a teacher's effectiveness at raising standardized test scores and, as such, capture only one aspect of a teacher's work.
Overall value-added effectiveness


Math effectiveness

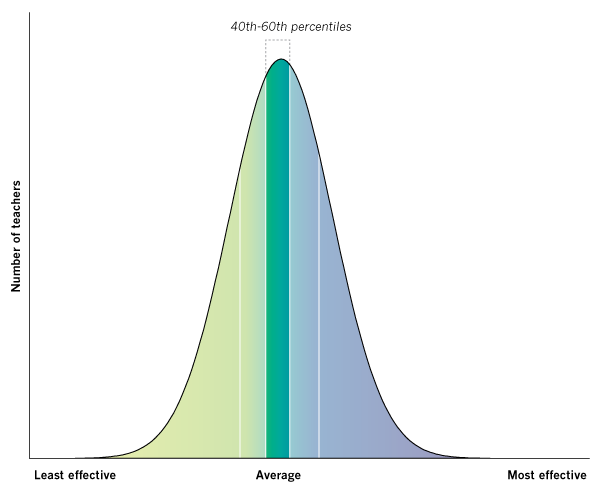
English effectiveness
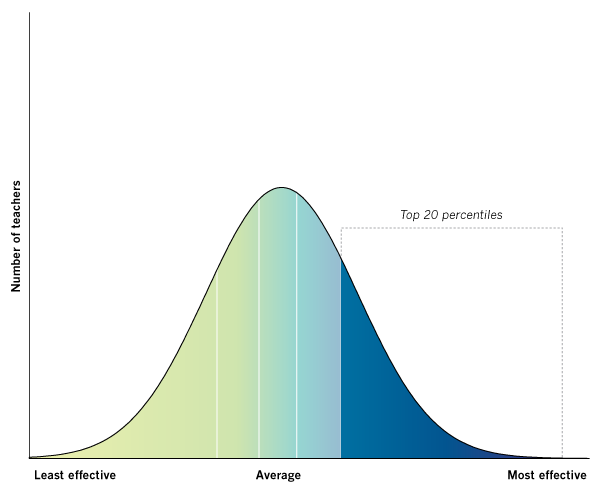
Compared with other Los Angeles Unified teachers on the value-added measure of test score improvement, Robertson ranked:
- More effective than average overall.
- Most effective in math. Students of teachers in this category, on average, gained about 11 percentile points on the California Standards Test compared with other students at their grade level.
- Average in English. Students of teachers in this category, on average, did not gain or lose significantly on the California Standards Test compared with other students at their grade level.
Robertson's LAUSD teaching history
2002-03 through 2008-09 academic years
- Betty Plasencia Elementary, 2009 - 2003
Carol Robertson's Response:

When the statistical error average for these value added scores is 25% but the acceptable error average is 8 - 9%, how can these scores be useful? What is the point of printing this analysis when it is potentially so inaccurate? Couldn't a more truthful and reliable analysis have been used to enlighten the public? If the Times were my student, I'd have to give them a report card score of 2 (on a 1 - 4 scale). You tried but next time check your work a little more thoroughly first.
![]() The Times gave LAUSD elementary school teachers rated in this database the opportunity to preview their value-added evaluations and publicly respond. Some issues raised by teachers may be addressed in the FAQ. Teachers who have not commented may do so by contacting The Times.
The Times gave LAUSD elementary school teachers rated in this database the opportunity to preview their value-added evaluations and publicly respond. Some issues raised by teachers may be addressed in the FAQ. Teachers who have not commented may do so by contacting The Times.
|
|
 Delicious
|
 Digg
Digg
|
 Facebook
|
 Twitter
|